Back to demo index

gnuplot demo script: errorbars.dem

autogenerated by webify.pl on Sun Sep 17 19:54:20 2023
gnuplot version gnuplot 6.0 patchlevel rc2
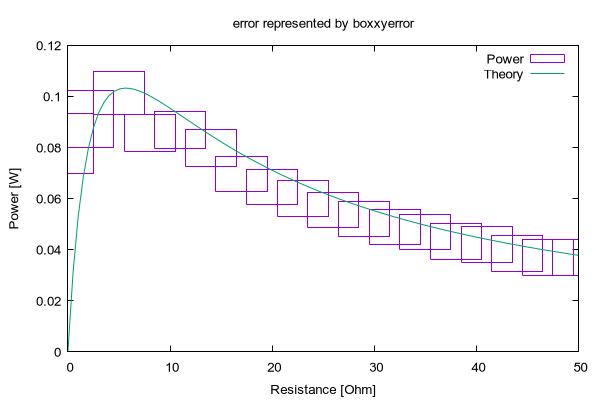
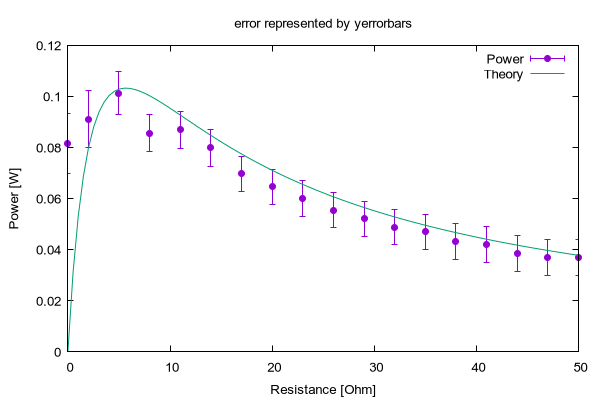
# Second part of old mgr.dem
# Show the same plot with various errorbar styles
#
print "various styles of errorbar"

set xlabel "Resistance [Ohm]"
set ylabel "Power [W]"

set title "error represented by xyerrorbars"
n(x)=1.53**2*x/(5.67+x)**2
plot [0:50] "battery.dat" t "Power" with xyerrorbars, n(x) t "Theory" w lines


Click here for minimal script to generate this plot


set title "error represented by boxxyerror"
plot [0:50] "battery.dat" t "Power" with boxxyerr, n(x) t "Theory" w lines


Click here for minimal script to generate this plot


set title "error represented by xerrorbars"
plot [0:50] "battery.dat" u 1:2:3 t "Power" w xerr, n(x) t "Theory" w lines


Click here for minimal script to generate this plot


set title "error represented by yerrorbars"
plot [0:50] "battery.dat" u 1:2:4 t "Power" w yerr, n(x) t "Theory" w lines


Click here for minimal script to generate this plot


set title "yerrorbars in log scale"
set logscale y
plot [0:50] "battery.dat" u 1:2:4 t "Power" w yerr, n(x) t "Theory" w lines


Click here for minimal script to generate this plot


set title "xyerrorbars in log scale"
set logscale xy
plot [1:50] "battery.dat" t "Power" w xyerr, n(x) t "Theory" w lines


Click here for minimal script to generate this plot


set title "xyerrorbars with no crossbar"
unset logscale
set bars small
plot [0:50] "battery.dat" t "Power" with xyerrorbars, n(x) t "Theory" w lines


Click here for minimal script to generate this plot


set title "xerrorbars with no crossbar"
plot [0:50] "battery.dat" u 1:2:3 t "Power" w xerr, n(x) t "Theory" w lines


Click here for minimal script to generate this plot


set title "yerrorbars with no crossbar"
plot [0:50] "battery.dat" u 1:2:4 t "Power" w yerr, n(x) t "Theory" w lines


Click here for minimal script to generate this plot


set title "Error on y represented by filledcurve shaded region"
set xlabel "Time (sec)" 
set ylabel "Rate" 
set grid xtics mxtics ytics mytics
set log y
Shadecolor = "#80E0A080"
#
plot 'silver.dat' using 1:($2+$3):($2-$3) \
      with filledcurve fc rgb Shadecolor title "Shaded error region",\
     '' using 1:2 smooth mcspline lw 2   title "Monotonic spline through data"


Click here for minimal script to generate this plot