
# # Example of using histogram modes # reset set title "US immigration from Europe by decade" set datafile missing "-" set xtics nomirror rotate by -45 # # First plot using linespoints set style data linespoints set key autotitle columnhead plot 'immigration.dat' using 2:xtic(1), \ '' u 3, '' u 4, '' u 5, '' u 6, \ '' u 7, '' u 8, '' u 9, '' u 10, \ '' u 11, '' u 12, '' u 13, '' u 14, \ '' u 15, '' u 16, '' u 17, '' u 18, \ '' u 19, '' u 20, '' u 21, '' u 22 #Click here for minimal script to generate this plot

# set title "US immigration from Northern Europe\nPlot selected data columns as histogram of clustered boxes" set auto x set yrange [0:300000] set style data histogram set style histogram cluster gap 1 set style fill solid border -1 set boxwidth 0.9 set xtic rotate by -45 #set bmargin 10 plot 'immigration.dat' using 6:xtic(1) ti col, '' u 12 ti col, '' u 13 ti col, '' u 14 ti col #Click here for minimal script to generate this plot

# set title "US immigration from Northern Europe\n(same plot with larger gap between clusters)" set style histogram gap 5 replot #Click here for minimal script to generate this plot

# # # Stacked histograms # set title "US immigration from Europe by decade\nPlot as stacked histogram" set key invert reverse Left outside set key autotitle columnheader set yrange [0:7e6] set auto x unset xtics set xtics nomirror rotate by -45 set style data histogram set style histogram rowstacked set style fill solid border -1 set boxwidth 0.75 # plot 'immigration.dat' using 2:xtic(1), \ '' using 3, \ '' using 4, \ '' using 5, \ '' using 6, \ '' using 7, \ '' using 8, \ '' using 9, \ '' using 10, \ '' using 11, \ '' using 12, \ '' using 13, \ '' using 14, \ '' using 15, \ '' using 16, \ '' using 17, \ '' using 18, \ '' using 19, \ '' using 20, \ '' using 21, \ '' using 22 #Click here for minimal script to generate this plot

# # Stacked histograms by percent # set title "US immigration from Europe by decade\nFraction of total plotted as stacked histogram" set key invert reverse Left outside set yrange [0:100] set ylabel "% of total" unset ytics set grid y set border 3 set style data histograms set style histogram rowstacked set style fill solid border -1 set boxwidth 0.75 # plot 'immigration.dat' using (100.*$2/$24):xtic(1) title column(2), \ '' using (100.*$3/$24) title column(3), \ '' using (100.*$4/$24) title column(4), \ '' using (100.*$5/$24) title column(5), \ '' using (100.*$6/$24) title column(6), \ '' using (100.*$7/$24) title column(7), \ '' using (100.*$8/$24) title column(8), \ '' using (100.*$9/$24) title column(9), \ '' using (100.*$10/$24) title column(10), \ '' using (100.*$11/$24) title column(11), \ '' using (100.*$12/$24) title column(12), \ '' using (100.*$13/$24) title column(13), \ '' using (100.*$14/$24) title column(14), \ '' using (100.*$15/$24) title column(15), \ '' using (100.*$16/$24) title column(16), \ '' using (100.*$17/$24) title column(17), \ '' using (100.*$18/$24) title column(18), \ '' using (100.*$19/$24) title column(19), \ '' using (100.*$20/$24) title column(20), \ '' using (100.*$21/$24) title column(21), \ '' using (100.*$22/$24) title column(22), \ '' using (100.*$23/$24) title column(23) #Click here for minimal script to generate this plot
#
# Columnstacks
# xtic labels should be picked up from column heads ('title column')
# key titles should be picked up from row heads ('key(1)')
#
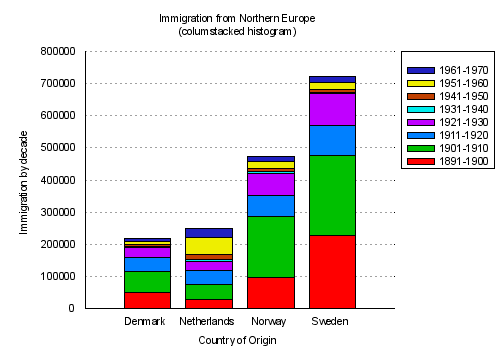
set title "Immigration from Northern Europe\n(columstacked histogram)"
set style histogram columnstacked
set key noinvert box
set yrange [0:*]
set ylabel "Immigration by decade"
set xlabel "Country of Origin"
set tics scale 0.0
set ytics
unset xtics
set xtics norotate nomirror
plot 'immigration.dat' using 6 ti col, '' using 12 ti col, \
'' using 13 ti col, '' using 14:key(1) ti col
#
Click here for minimal script to generate this plot
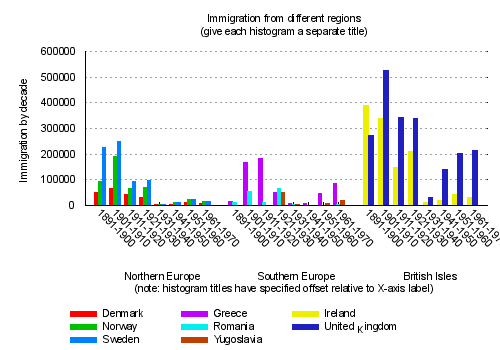
# # 'newhistogram' keyword to plot # set title "Immigration from different regions\n(give each histogram a separate title)" set key under nobox set key autotitle columnhead set style histogram clustered gap 1 title offset 2,0.25 set style fill solid noborder set boxwidth 0.95 unset xtics set xtics nomirror rotate by -45 set xlabel "(note: histogram titles have specified offset relative to X-axis label)" offset 0,-2 set ytics set grid y set auto y plot \ newhistogram "Northern Europe", \ 'immigration.dat' using 6:xtic(1), '' u 13, '' u 14, \ newhistogram "Southern Europe", \ '' u 9:xtic(1), '' u 17, '' u 22, \ newhistogram "British Isles", \ '' u 10:xtic(1), '' u 21 #Click here for minimal script to generate this plot

# set style histogram rows set boxwidth 0.8 set yrange [0:900000] set xlabel "(Same plot using rowstacked rather than clustered histogram)" replot #Click here for minimal script to generate this plot
