
# # $Id: prob.dem,v 1.9 2006/06/14 03:24:09 sfeam Exp $ # # Demo Statistical Functions version 2.3 # # Copyright (c) 1991, 1992 Jos van der Woude, jvdwoude@hut.nl # History: # -- --- 1992 Jos van der Woude: 1st version # 06 Jun 2006 Dan Sebald: Added some variety and plotting techniques for # better visual effect. More tutorial in nature. print " Statistical Library Demo, version 2.3" print "\n Copyright (c) 1991, 1992, Jos van de Woude, jvdwoude@hut.nl" print "\n\n\n\n\n\n\n" print "NOTE: contains 54 plots and consequently takes a lot of time to run" print " Press Ctrl-C to exit right now"Click here for minimal script to generate this plot

load "stat.inc"

eps = 1.0e-10  # Supposed to be float resolution (nice if were defined internally)

## Gamma function
xmin = -5.5
xmax = 5
ymin = -10
ymax = 10
unset key
set xzeroaxis
gsampfunc(t,n) = t<0?0.5*1/(-t+1.0)**n:1.0-0.5*1/(t+1.0)**n
set parametric
set trange [-1:1]
set sample 200
set xrange [xmin : xmax]
set yrange [ymin : ymax]
set xlabel "x"
set ylabel "gamma(x)"
set arrow 1 from  0,ymin to  0,ymax nohead lt 0
set arrow 2 from -1,ymin to -1,ymax nohead lt 0
set arrow 3 from -2,ymin to -2,ymax nohead lt 0
set arrow 4 from -3,ymin to -3,ymax nohead lt 0
set arrow 5 from -4,ymin to -4,ymax nohead lt 0
set arrow 6 from -5,ymin to -5,ymax nohead lt 0
set title "gamma function, very useful function for probability"
plot gsampfunc(5*t,5)-6, gamma(gsampfunc(5*t,5)-6) lt 1, \
     gsampfunc(5*t,5)-5, gamma(gsampfunc(5*t,5)-5) lt 1, \
     gsampfunc(5*t,4)-4, gamma(gsampfunc(5*t,4)-4) lt 1, \
     gsampfunc(5*t,3)-3, gamma(gsampfunc(5*t,3)-3) lt 1, \
     gsampfunc(5*t,2)-2, gamma(gsampfunc(5*t,2)-2) lt 1, \
     gsampfunc(5*t,1)-1, gamma(gsampfunc(5*t,1)-1) lt 1, \
     5*gsampfunc(5*t,2), gamma(5*gsampfunc(5*t,2)) lt 1

Click here for minimal script to generate this plot

ymin = ymin/2
ymax = ymax/2
set yrange [ymin:ymax]
set ylabel "lgamma(x)"
set arrow 1 from  0,ymin to  0,ymax nohead lt 0
set arrow 2 from -1,ymin to -1,ymax nohead lt 0
set arrow 3 from -2,ymin to -2,ymax nohead lt 0
set arrow 4 from -3,ymin to -3,ymax nohead lt 0
set arrow 5 from -4,ymin to -4,ymax nohead lt 0
set arrow 6 from -5,ymin to -5,ymax nohead lt 0
set title "log gamma function, similarly very useful function"
plot gsampfunc(5*t,5)-6, lgamma(gsampfunc(5*t,5)-6) lt 1, \
     gsampfunc(5*t,5)-5, lgamma(gsampfunc(5*t,5)-5) lt 1, \
     gsampfunc(5*t,4)-4, lgamma(gsampfunc(5*t,4)-4) lt 1, \
     gsampfunc(5*t,3)-3, lgamma(gsampfunc(5*t,3)-3) lt 1, \
     gsampfunc(5*t,3)-2, lgamma(gsampfunc(5*t,3)-2) lt 1, \
     gsampfunc(5*t,3)-1, lgamma(gsampfunc(5*t,3)-1) lt 1, \
     5*gsampfunc(5*t,3), lgamma(5*gsampfunc(5*t,3)) lt 1

Click here for minimal script to generate this plot

reset # Arcsinus PDF and CDF r = 2.0 mu = 0.0 sigma = r / sqrt2 xmin = -(r+1) xmax = r+1 unset key set zeroaxis set xrange [xmin : xmax] set yrange [-0.2 : 1.2] set xlabel "x ->" set ylabel "probability density ->" set xtics autofreq set ytics autofreq set format x "%.1f" set format y "%.1f" set sample 50*xmax+1 set title "arcsin PDF with r = 2.0" plot arcsin(x, r)Click here for minimal script to generate this plot

set title "arcsin CDF with r = 2.0" set yrange [-0.2 : 1.2] plot carcsin(x, r)Click here for minimal script to generate this plot

# Beta PDF and CDF
p = 5.0; q = 3.0
mu = p / (p + q)
sigma = sqrt(p**q) / ((p + q ) * sqrt(p + q + 1.0))
xmin = 0.0
xmax = 1.0
#Mode of beta PDF used
ymax = (p < 1.0 || q < 1.0) ? 2.0 : 1.4 * beta((p - 1.0)/(p + q - 2.0), p, q)
set key right box
set zeroaxis
set xrange [xmin : xmax]
set yrange [0 : ymax]
set xlabel "x ->"
set ylabel "probability density ->"
set xtics autofreq
set ytics autofreq
set format x "%.1f"
set format y "%.1f"
set sample 200
set title "beta PDF"
plot beta(x, 0.5, 0.7) title "p = 0.5, q = 0.7", \
     beta(x, 5.0, 3.0) title "p = 5.0, q = 3.0", \
     beta(x, 0.5, 2.5) title "p = 0.5, q = 2.5"

Click here for minimal script to generate this plot

set yrange [0:1.1]
set title "incomplete beta CDF"
set key left box
plot cbeta(x, 0.5, 0.7) title "p = 0.5, q = 0.7", \
     cbeta(x, 5.0, 3.0) title "p = 5.0, q = 3.0", \
     cbeta(x, 0.5, 2.5) title "p = 0.5, q = 2.5"

Click here for minimal script to generate this plot
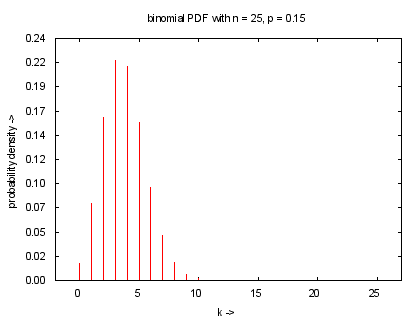
# Binomial PDF and CDF n = 25; p = 0.15 mu = n * p sigma = sqrt(n * p * (1.0 - p)) xmin = int(mu - 4.0 * sigma) xmin = xmin < -2 ? -2 : xmin xmax = int(mu + 4.0 * sigma) xmax = xmax < n+2 ? n+2 : xmax ymax = 1.1 * binom(int((n+1)*p), n, p) #Mode of binomial PDF used unset key unset zeroaxis set xrange [xmin : xmax] set yrange [0 : ymax] set xlabel "k ->" set ylabel "probability density ->" set ytics 0, ymax / 10, ymax set format x "%2.0f" set format y "%3.2f" set sample (xmax - xmin) + 1 set title "binomial PDF with n = 25, p = 0.15" plot binom(x, n, p) with impulsesClick here for minimal script to generate this plot

set ytics autofreq set xzeroaxis set title "binomial CDF with n = 25, p = 0.15" set yrange [-0.1 : 1.1] set ytics 0, 0.1, 1.0 plot cbinom(x, n, p) with stepsClick here for minimal script to generate this plot

# Cauchy PDF and CDF
a = 0.0; b = 2.0
#cauchy PDF has no moments
xmin = a - 5.0 * b
xmax = a + 5.0 * b
ymax = 1.1 * cauchy(a, a, b) #Mode of cauchy PDF used
set key left box
set zeroaxis
set xlabel "x ->"
set ylabel "probability density ->"
set xtics autofreq
set ytics autofreq
set format x "%.1f"
set format y "%.2f"
set sample 100
set title "cauchy PDF"
a=0
b=2
plot [xmin:xmax] [0:ymax] cauchy(x, 0, 2) title "a = 0, b = 2", \
                          cauchy(x, 0, 4) title "a = 0, b = 4"

Click here for minimal script to generate this plot

set title "cauchy CDF"
plot [xmin:xmax] [0:1.0] ccauchy(x, 0, 2) title "a = 0, b = 2", \
                         ccauchy(x, 0, 4) title "a = 0, b = 4"

Click here for minimal script to generate this plot

# Chi-square PDF and CDF
k = 4.0
mu = k
sigma = sqrt(2.0 * k)
xmin = mu - 4.0 * sigma
xmin = xmin < 0 ? 0 : xmin
xmax = int(mu + 4.0 * sigma)
k = 2.0
ymax = (k > 2.0 ? 1.1*chisq(k - 2.0, k) : 0.5) #Mode of chi PDF used
set key right box
set zeroaxis
set xrange [xmin+eps : xmax] #Discontinuity at zero for k < 2
set yrange [0:ymax]
set xlabel "x ->"
set ylabel "probability density ->"
set xtics autofreq
set ytics autofreq
set format x "%.1f"
set format y "%.2f"
set sample 100
set title "chi-square PDF"
set key right box
set samples 15*20+1
keystr(k) = sprintf("k = %d", k)
plot k = 1, x==0?1/0:chisq(x, k) title keystr(k), \
     k = 2, x==0?1/0:chisq(x, k) title keystr(k), \
     k = 3, chisq(x, k) title keystr(k), \
     k = 4, chisq(x, k) title keystr(k), \
     k = 5, chisq(x, k) title keystr(k), \
     k = 6, chisq(x, k) title keystr(k), \
     k = 7, chisq(x, k) title keystr(k), \
     k = 8, chisq(x, k) title keystr(k)

Click here for minimal script to generate this plot

set yrange [0:1.1]
set key bottom right box
set title "chi-square CDF"
plot k = 1, cchisq(x, k) title keystr(k), \
     k = 2, cchisq(x, k) title keystr(k), \
     k = 3, cchisq(x, k) title keystr(k), \
     k = 4, cchisq(x, k) title keystr(k), \
     k = 5, cchisq(x, k) title keystr(k), \
     k = 6, cchisq(x, k) title keystr(k), \
     k = 7, cchisq(x, k) title keystr(k), \
     k = 8, cchisq(x, k) title keystr(k)

Click here for minimal script to generate this plot

# Erlang PDF and CDF
lambda = 1.0; n = 2.0
mu = n / lambda
sigma = sqrt(n) / lambda
xmax = int(mu + 5.0 * sigma)
n = 1.0
ymax = n < 2.0 ? 1.0 : 1.1 * erlang((n - 1.0) / lambda, n, lambda) #Mode of erlang PDF used
set zeroaxis
set xlabel "x ->"
set ylabel "probability density ->"
set xtics autofreq
set ytics autofreq
set format x "%.1f"
set format y "%.1f"
set sample 100
set title "erlang PDF"
set key top right box
l1 = 1.0; l2 = 0.5
set arrow 1 from 2,0.8 to 0.33,erlang(0.33,1,l1)
set arrow 2 from 2,0.8 to 0.33,erlang(0.33,1,l2)
set label 1 "n = 1, exponential r.v." at 2.1,0.8 left
keystr(n,lambda) = sprintf("lambda = %0.1f, n = %d", lambda, n)
plot [0:xmax] [0:ymax] n = 1, lambda = l1, erlang(x, n, lambda) title keystr(n,lambda), \
                       n = 1, lambda = l2, erlang(x, n, lambda) title keystr(n,lambda), \
                       n = 2, lambda = l1, erlang(x, n, lambda) title keystr(n,lambda), \
                       n = 2, lambda = l2, erlang(x, n, lambda) title keystr(n,lambda)

Click here for minimal script to generate this plot

unset label 1
unset arrow 1; unset arrow 2
set title "erlang CDF"
set key bottom right box
plot [0:xmax] [0:1.1] n = 1, lambda = l1, cerlang(x, n, lambda) title keystr(n,lambda), \
                      n = 1, lambda = l2, cerlang(x, n, lambda) title keystr(n,lambda), \
                      n = 2, lambda = l1, cerlang(x, n, lambda) title keystr(n,lambda), \
                      n = 2, lambda = l2, cerlang(x, n, lambda) title keystr(n,lambda)

Click here for minimal script to generate this plot

# Thanks to mrb2j@kelvin.seas.Virginia.EDU for telling us about this.
# Extreme (Gumbel extreme value) PDF and CDF
alpha = 1.0; u = 0.0
mu = u + (0.577215665/alpha)   # Euler's constant
sigma = pi/(sqrt(6.0)*alpha)
xmin = mu - 6.0 * sigma
xmax = mu + 6.0 * sigma
ymax = 1.1 * extreme(u, u, alpha) #Mode of extreme PDF used
ymax = int(10*ymax)/10.0
set zeroaxis
set xlabel "x ->"
set ylabel "probability density ->"
set xtics autofreq
set ytics autofreq
set format x "%.1f"
set format y "%.2f"
set sample 100
set title "extreme PDF"
set key top left box
plot [xmin:xmax] [0:ymax] extreme(x, 1.0, 0.5) title "alpha = 0.5, u = 1.0", \
                          extreme(x, 0.0, 1.0) title "alpha = 1.0, u = 0.0"

Click here for minimal script to generate this plot

set title "extreme CDF"
plot [xmin:xmax] [0:1.1] cextreme(x, 1.0, 0.5) title "alpha = 0.5, u = 1.0", \
                         cextreme(x, 0.0, 1.0) title "alpha = 1.0, u = 0.0"

Click here for minimal script to generate this plot

# F PDF and CDF
df1 = 5.0; df2 = 9.0
mu = df2 < 2.0 ? 1.0 : df2 / (df2 - 2.0)
sigma = df2 < 4.0 ? 1.0 : mu * sqrt(2.0 * (df1 + df2 - 2.0) / (df1 * (df2 - 4.0)))
xmin = mu - 3.0 * sigma
xmin = xmin < 0 ? 0 : xmin
xmax = int(mu + 3.0 * sigma)
#Mode of F PDF used
ymax = df1 < 3.0 ? 1.0 : 1.1 * f((df1 / 2.0 - 1.0) / (df1 / 2.0 + df1 / df2), df1, df2)
set zeroaxis
set xlabel "x ->"
set ylabel "probability density ->"
set xtics autofreq
set ytics autofreq
set format x "%.1f"
set format y "%.2f"
set sample 100
set title "F PDF"
set key right box
plot [xmin:xmax] [0:ymax] f(x, 5.0, 9.0) title "df1 = 5, df2 = 9", \
                          f(x, 7.0, 6.0) title "df1 = 7, df2 = 6"

Click here for minimal script to generate this plot

set title "F CDF"
set key left box
plot [xmin:xmax] [0:1.1] cf(x, 5.0, 9.0) title "df1 = 5, df2 = 9", \
                         cf(x, 7.0, 6.0) title "df1 = 7, df2 = 6"

Click here for minimal script to generate this plot

# Gamma PDF and incomplete gamma CDF
rho = 1.0; lambda = 1.3
mu = rho / lambda
sigma = sqrt(rho) / lambda
xmin = mu - 4.0 * sigma
xmin = xmin < 0 ? 0 : xmin
xmax = mu + 4.0 * sigma
ymax = rho < 1.0 ? 2.0 : 1.1 * gmm((rho - 1.0) / lambda, rho, lambda) #Mode of gamma pdf used
set zeroaxis
set xlabel "x ->"
set ylabel "probability density ->"
set xtics autofreq
set ytics autofreq
set format x "%.1f"
set format y "%.1f"
set sample 100
set title "gamma PDF"
set key right
r1 = 0.5; r2 = 1.0; r3 = 1.0; r4 = 1.3; r5 = 2.0; r6 = 4.0; r7 = 6.0
l1 = 1.0; l2 = 1.0; l3 = 1.3; l4 = 1.3; l5 = 2.0; l6 = 2.0; l7 = 2.0
set arrow 1 from 1,1.3 to 0.15,gmm(0.15,r1,l1)
set label 1 "rho < 1, tends to infinity" at 1.1,1.3 left
set arrow 2 from 1.15,1.1 to 0.35,gmm(0.35,r3,l3)
set label 2 "rho = 1, finite, nonzero limit" at 1.25,1.1 left
set arrow 3 from 1.5,0.9 to 1.0,gmm(1.0,r5,l5)
set label 3 "rho > 1, tends to zero" at 1.6,0.9 left
keystr(rho,lambda) = sprintf("rho = %0.1f, lambda = %0.1f", rho, lambda)
plot [0:5] [0:1.5] rho = r1, lambda = l1, gmm(x, rho, lambda) title keystr(rho,lambda), \
                   rho = r2, lambda = l2, gmm(x, rho, lambda) title keystr(rho,lambda), \
                   rho = r3, lambda = l3, gmm(x, rho, lambda) title keystr(rho,lambda), \
                   rho = r4, lambda = l4, gmm(x, rho, lambda) title keystr(rho,lambda), \
                   rho = r5, lambda = l5, gmm(x, rho, lambda) title keystr(rho,lambda), \
                   rho = r6, lambda = l6, gmm(x, rho, lambda) title keystr(rho,lambda), \
                   rho = r7, lambda = l7, gmm(x, rho, lambda) title keystr(rho,lambda)

Click here for minimal script to generate this plot

unset label 1; unset label 2; unset label 3
unset arrow 1; unset arrow 2; unset arrow 3
set title "incomplete gamma CDF"
set key right bottom
plot [0:5] [0:1.1] rho = r1, lambda = l1, cgmm(x, rho, lambda) title keystr(rho,lambda), \
                   rho = r2, lambda = l2, cgmm(x, rho, lambda) title keystr(rho,lambda), \
                   rho = r3, lambda = l3, cgmm(x, rho, lambda) title keystr(rho,lambda), \
                   rho = r4, lambda = l4, cgmm(x, rho, lambda) title keystr(rho,lambda), \
                   rho = r5, lambda = l5, cgmm(x, rho, lambda) title keystr(rho,lambda), \
                   rho = r6, lambda = l6, cgmm(x, rho, lambda) title keystr(rho,lambda), \
                   rho = r7, lambda = l7, cgmm(x, rho, lambda) title keystr(rho,lambda)

Click here for minimal script to generate this plot

# Geometric PDF and CDF p = 0.4 mu = (1.0 - p) / p sigma = sqrt(mu / p) xmin = int(mu - 4.0 * sigma) xmin = xmin < -1 ? -1 : xmin xmin = -1 xmax = int(mu + 4.0 * sigma) ymax = 1.1 * geometric(0, p) #mode of geometric PDF used unset key unset zeroaxis set xrange [xmin : xmax] set yrange [0 : ymax] set xlabel "k ->" set ylabel "probability density ->" set ytics 0, ymax / 10, ymax set format x "%2.0f" set format y "%3.2f" set sample (xmax - xmin) + 1 set title "geometric PDF with p = 0.4" plot geometric(x, p) with impulsesClick here for minimal script to generate this plot

set title "geometric CDF with p = 0.4" set yrange [0 : 1.1] set ytics 0, 0.1, 1.0 plot cgeometric(x, p) with stepsClick here for minimal script to generate this plot

# Half normal PDF and CDF mu = sqrt2invpi sigma = 1.0 s = sigma*sqrt(1.0 - 2.0/pi) xmin = -0.2 xmax = mu + 4.0 * s ymax = 1.1 * halfnormal(0, sigma) #Mode of half normal PDF used unset key set zeroaxis set xrange [xmin: xmax] set yrange [-0.1: ymax] set xlabel "x ->" set ylabel "probability density ->" set xtics autofreq set ytics autofreq set format x "%.1f" set format y "%.1f" set sample 100 set parametric set trange [xmin:xmax] set title "half normal PDF, sigma = 1.0" set arrow 1 from 0.5,0.13 to 0.0,0.4 set label 1 "Discontinuity achieved by plotting\ntwice with limited parametric ranges" at 0.2,0.1 left plot t<0?t:-eps, halfnormal(t<0?t:-eps, sigma) ls 1, t<0?0.0:t, halfnormal(t<0?0.0:t, sigma) ls 1Click here for minimal script to generate this plot

set title "half normal CDF, sigma = 1.0" set yrange [-0.1:1.1] set arrow 1 from 0.45,0.1 to 0.05,0.01 set label 1 "Cusp achieved by plotting twice\nwith limited parametric ranges" at 0.5,0.1 left plot t<0?t:-eps, chalfnormal(t<0?t:-eps, sigma) ls 1, t<0?0.0:t, chalfnormal(t<0?0.0:t, sigma) ls 1Click here for minimal script to generate this plot

unset label 1 unset arrow 1 unset parametric # Hypergeometric PDF and CPF N = 75; C = 25; d = 10 p = real(C) / N mu = d * p sigma = sqrt(real(N - d) / (N - 1.0) * d * p * (1.0 - p)) xmin = int(mu - 4.0 * sigma) xmin = xmin < -1 ? -1 : xmin xmax = int(mu + 4.0 * sigma) xmax = xmax < d+1 ? d+1 : xmax ymax = 1.1 * hypgeo(int(mu),N,C,d) # approximate mode of hypergeometric PDF used unset key unset zeroaxis set xrange [xmin : xmax] set yrange [0 : ymax] set xlabel "k ->" set ylabel "probability density ->" set ytics 0, ymax / 10, ymax set format x "%2.0f" set format y "%3.2f" set sample (xmax - xmin) + 1 set title "hypergeometric PDF with N = 75, C = 25, d = 10" plot hypgeo(x,N,C,d) with impulsesClick here for minimal script to generate this plot

set yrange [0 : 1.1] set ytics 0, 1.0 / 10.0, 1.1 set title "hypergeometric CDF with N = 75, C = 25, d = 10" plot chypgeo(x,N,C,d) with stepsClick here for minimal script to generate this plot

# Laplace PDF mu = 0.0; b = 1.0 sigma = sqrt(2.0) * b xmin = mu - 4.0 * sigma xmax = mu + 4.0 * sigma ymax = 1.1 * laplace(mu, mu, b) #Mode of laplace PDF used unset key set zeroaxis set xrange [xmin: xmax] set yrange [0: ymax] set xlabel "x ->" set ylabel "probability density ->" set xtics autofreq set ytics autofreq set format x "%.1f" set format y "%.2f" set sample 100+1 set title "laplace (or double exponential) PDF with mu = 0, b = 1" set arrow 1 from -0.95,0.5 to -0.1,0.5 set label 1 "Cusp achieved by selecting point\nas part of function samples" at -1.0,0.5 right plot laplace(x, mu, b)Click here for minimal script to generate this plot

unset label 1 unset arrow 1 set title "laplace (or double exponential) CDF with mu = 0, b = 1" set yrange [0: 1.1] plot claplace(x, mu, b)Click here for minimal script to generate this plot

# Logistic PDF and CDF a = 0.0; lambda = 2.0 mu = a sigma = pi / (sqrt(3.0) * lambda) xmin = mu - 4.0 * sigma xmax = mu + 4.0 * sigma ymax = 1.1 * logistic(mu, a, lambda) #Mode of logistic PDF used unset key set zeroaxis set xrange [xmin: xmax] set yrange [0: ymax] unset key set zeroaxis set xlabel "x ->" set ylabel "probability density ->" set xtics autofreq set ytics autofreq set format x "%.1f" set format y "%.1f" set sample 100 set title "logistic PDF with a = 0, lambda = 2" plot logistic(x, a, lambda)Click here for minimal script to generate this plot

set title "logistic CDF with a = 0, lambda = 2" set yrange [0: 1.1] plot clogistic(x, a, lambda)Click here for minimal script to generate this plot

# Lognormal PDF and CDF mu = 1.0; sigma = 0.5 m = exp(mu + 0.5 * sigma**2) s = sqrt(exp(2.0 * mu + sigma**2) * (2.0 * exp(sigma) - 1.0)) xmin = m - 4.0 * s xmin = xmin < 0 ? 0 : xmin xmax = m + 4.0 * s ymax = 1.1 * lognormal(exp(mu - sigma**2), mu, sigma) #Mode of lognormal PDF used unset key set zeroaxis set xrange [xmin: xmax] set yrange [0: ymax] set xlabel "x ->" set ylabel "probability density ->" set xtics autofreq set ytics autofreq set format x "%.2f" set format y "%.2f" set sample 100 set title "lognormal PDF with mu = 1.0, sigma = 0.5" plot lognormal(x, mu, sigma)Click here for minimal script to generate this plot

set title "lognormal CDF with mu = 1.0, sigma = 0.5" set yrange [0: 1.1] plot clognormal(x, mu, sigma)Click here for minimal script to generate this plot

# Maxwell PDF
a = 0.5
mu = 2.0 / sqrt(pi) / a
sigma = sqrt(3.0 - 8.0/pi) / a
xmin = int(mu - 3.0 * sigma)
xmin = xmin < 0 ? 0 : xmin
xmax = int(mu + 3.0 * sigma)
a = 1.5
ymax = 1.1 * maxwell(1.0 / a, a) + 0.5 #Mode of maxwell PDF used
ymax = int(ymax + 0.5)
set zeroaxis
set xlabel "x ->"
set ylabel "probability density ->"
set xtics autofreq
set ytics autofreq
set format x "%.1f"
set format y "%.1f"
set sample 100
set title "maxwell PDF"
set key right top box
plot [xmin:xmax] [0:ymax] maxwell(x, 1.5) title "a = 1.5", \
                   maxwell(x, 1.0) title "a = 1.0", \
                   maxwell(x, 0.5) title "a = 0.5"

Click here for minimal script to generate this plot

set title "maxwell CDF"
set key right bottom box
plot [xmin:xmax] [0:1.1] cmaxwell(x, 1.5) title "a = 1.5", \
                         cmaxwell(x, 1.0) title "a = 1.0", \
                         cmaxwell(x, 0.5) title "a = 0.5"

Click here for minimal script to generate this plot

# Negative binomial PDF and CDF r = 8; p = 0.4 mu = r * (1.0 - p) / p sigma = sqrt(mu / p) xmin = int(mu - 4.0 * sigma) xmin = xmin < 0 ? 0 : xmin xmax = int(mu + 4.0 * sigma) ymax = 1.1 * negbin(int(mu - (1.0-p)/p), r, p) #mode of gamma PDF used unset key unset zeroaxis set xrange [xmin-1 : xmax] set yrange [0 : ymax] set xlabel "k ->" set ylabel "probability density ->" set ytics 0, ymax / 10, ymax set format x "%2.0f" set format y "%3.2f" set sample (xmax - xmin+1) + 1 set title "negative binomial (or pascal or polya) PDF with r = 8, p = 0.4" plot negbin(x, r, p) with impulsesClick here for minimal script to generate this plot

set yrange [0 : 1.1] set ytics 0, 0.1, 1.0 set title "negative binomial (or pascal or polya) CDF with r = 8, p = 0.4" plot cnegbin(x, r, p) with stepsClick here for minimal script to generate this plot

# Negative exponential PDF and CDF lambda = 2.0 mu = 1.0 / lambda sigma = 1.0 / lambda xmax = mu + 4.0 * sigma ymax = lambda #No mode unset key set zeroaxis set xrange [0: xmax] set yrange [0: ymax] set xlabel "x ->" set ylabel "probability density ->" set xtics autofreq set ytics autofreq set format x "%.2f" set format y "%.1f" set sample 100 set title "negative exponential (or exponential) PDF with lambda = 2.0" plot nexp(x, lambda)Click here for minimal script to generate this plot

set title "negative exponential (or exponential) CDF with lambda = 2.0" set yrange [0: 1.1] plot cnexp(x, lambda)Click here for minimal script to generate this plot

# Normal PDF and CDF
mu = 0.0; sigma = 1.0
xmin = mu - 4.0 * sigma
xmax = mu + 4.0 * sigma
mu = 2.0; sigma = 0.5
ymax = 1.1 * normal(mu, mu, sigma) #Mode of normal PDF used
set zeroaxis
set xlabel "x ->"
set ylabel "probability density ->"
set xtics autofreq
set ytics autofreq
set format x "%.1f"
set format y "%.1f"
set sample 100
set title "normal (also called gauss or bell-curved) PDF"
set key left top box
plot [xmin:xmax] [0:ymax] normal(x, 0, 1.0) title "mu = 0, sigma = 1.0", \
                          normal(x, 2, 0.5) title "mu = 2, sigma = 0.5", \
                          normal(x, 1, 2.0) title "mu = 1, sigma = 2.0"

Click here for minimal script to generate this plot

set title "normal (also called gauss or bell-curved) CDF"
set key left top box
plot [xmin:xmax] [0:1.1] mu = 0, sigma = 1.0, cnormal(x, mu, sigma) title "mu = 0, sigma = 1.0", \
                         mu = 2, sigma = 0.5, cnormal(x, mu, sigma) title "mu = 2, sigma = 0.5", \
                         mu = 1, sigma = 2.0, cnormal(x, mu, sigma) title "mu = 1, sigma = 2.0"

Click here for minimal script to generate this plot

# Pareto PDF and CDF a = 1.0; b = 3.0 mu = a * b / (b - 1.0) sigma = a * sqrt(b) / (sqrt(b - 2.0) * (b - 1.0)) xmin = mu - 4.0 * sigma xmin = xmin < 0 ? 0 : xmin xmax = int(mu + 4.0 * sigma) ymax = 1.1 * pareto(a, a, b) #mode of pareto PDF used ymin = -0.1 * pareto(a, a, b) unset key set zeroaxis set xrange [xmin: xmax] set yrange [ymin: ymax] set xlabel "x ->" set ylabel "probability density ->" set xtics autofreq set ytics autofreq set format x "%.1f" set format y "%.1f" set sample 200+1 set title "pareto PDF with a = 1, b = 3" # Discontinuity at a set parametric set trange [0:1-eps] x1(t) = -1 + 2*t x2(t) = 1 + 3*t set arrow 1 from 1.75,0.8 to 1.0,0.8 set arrow 2 from 1.0,0.0 to 1.0,3.0 nohead lt 0 set label 1 "Discontinuity achieved by plotting twice\nwith affine mapped parametric ranges" at 1.8,0.8 left plot x1(t), pareto(x1(t), a, b) ls 1, x2(t), pareto(x2(t), a, b) ls 1Click here for minimal script to generate this plot

unset arrow 2 set title "pareto CDF with a = 1, b = 3" unset parametric set yrange [-0.1: 1.1] set arrow 1 from 1.45,0.1 to 1.05,0.01 set label 1 "Cusp achieved by selecting point\nas part of function samples" at 1.5,0.1 left plot cpareto(x, a, b)Click here for minimal script to generate this plot

unset label 1 unset arrow 1 # Poisson PDF and CDF mu = 4.0 sigma = sqrt(mu) xmin = int(mu - 4.0 * sigma) xmin = xmin < -1 ? -1 : xmin xmax = int(mu + 4.0 * sigma) ymax = 1.1 * poisson(mu, mu) #mode of poisson PDF used unset key set zeroaxis set xrange [xmin : xmax] set yrange [0 : ymax] set xlabel "k ->" set ylabel "probability density ->" set ytics 0, ymax / 10, ymax set format x "%2.0f" set format y "%3.2f" set sample (xmax - xmin) + 1 set title "poisson PDF with mu = 4.0" plot poisson(x, mu) with impulsesClick here for minimal script to generate this plot

set yrange [-0.1 : 1.1] set ytics -0.1, 0.1, 1.1 set title "poisson CDF with mu = 4.0" plot cpoisson(x, mu) with stepsClick here for minimal script to generate this plot

# Rayleigh PDF and CDF lambda = 2.0 mu = 0.5 * sqrt(pi / lambda) sigma = sqrt((1.0 - pi / 4.0) / lambda) xmax = mu + 4.0 * sigma ymax = 1.1 * rayleigh(1.0 / sqrt(2.0 * lambda), lambda) #Mode of rayleigh PDF used unset key set zeroaxis set xrange [0: xmax] set yrange [0: ymax] set xlabel "x ->" set ylabel "probability density ->" set xtics autofreq set ytics autofreq set format x "%.2f" set format y "%.1f" set sample 100 set title "rayleigh PDF with lambda = 2.0" plot rayleigh(x, lambda)Click here for minimal script to generate this plot

set title "rayleigh CDF with lambda = 2.0" set yrange [0: 1.1] plot crayleigh(x, lambda)Click here for minimal script to generate this plot

# Sine PDF and CDF
a = 3.2; f = 2.6
mu = a / 2.0
sigma = sqrt(a * a / 3.0 * (1.0 - 3.0 / (2.0 * n * n * pi * pi)) - mu * mu)
xmin = 0.0
xmax = a - eps
a = 2; f = 1.0
ymax = 1.1 * 2.0 / a #Mode of sine PDF used
set zeroaxis
set xlabel "x ->"
set ylabel "probability density ->"
set xtics autofreq
set ytics autofreq
set format x "%.2f"
set format y "%.1f"
set sample 250
set title "sine PDF"
set key bottom outside
keystr(a, f) = sprintf("a = %0.1f, f = %0.1f", a, f)
a1 = 2.0; a2 = 3.25; a3 = 2.75
f1 = 1.0; f2 = 3.0; f3 = 2.6; f4 = 0.0
plot [xmin:xmax] [0:ymax] a = a1, f = f1, sine(x, f, a) title keystr(a, f), \
                          a = a1, f = f2, sine(x, f, a) title keystr(a, f), \
                          a = a2, f = f3, sine(x, f, a) title keystr(a, f), \
                          a = a3, f = f4, sine(x, f, a) title keystr(a, f) with steps

Click here for minimal script to generate this plot

set title "sine CDF"
set key top left
plot [xmin:xmax] [0:1.1] a = a1, f = f1, csine(x, f, a) title keystr(a, f), \
                         a = a1, f = f2, csine(x, f, a) title keystr(a, f), \
                         a = a2, f = f3, csine(x, f, a) title keystr(a, f), \
                         a = a3, f = f4, csine(x, f, a) title keystr(a, f) with steps

Click here for minimal script to generate this plot

# t PDF and CDF
nu = 20
mu = 0
sigma = nu > 2 ? sqrt(nu / (nu - 2.0)) : 1.0
xmin = mu - 4.0 * sigma
xmax = mu + 4.0 * sigma
ymax = 1.1 * t(mu, nu) #Mode of t PDF used
set key inside center left title "degrees of freedom"
set zeroaxis
set xrange [xmin: xmax]
set yrange [0: ymax]
set xlabel "x ->"
set ylabel "probability density ->"
set xtics autofreq
set ytics autofreq
set format x "%.1f"
set format y "%.2f"
set sample 100
set title "t PDF (and Gaussian limit)"
ks(nu) = sprintf("nu = %d", nu)
plot t(x, 1) ti ks(1), t(x, 2) ti ks(2), t(x, 4) ti ks(4), t(x, 10) ti ks(10), \
     t(x, 20) ti ks(20), normal(x, 0, 1) ti "normal"

Click here for minimal script to generate this plot

set title "t CDF (and Gaussian limit)"
set yrange [0: 1.1]
plot ct(x, 1) ti ks(1), ct(x, 2) ti ks(2), ct(x, 4) ti ks(4), ct(x, 10) ti ks(10), \
     ct(x, 20) ti ks(20), cnormal(x, 0, 1) ti "normal"

Click here for minimal script to generate this plot

# Thanks to efrank@upenn5.hep.upenn.edu for telling us about this # triangular PDF and CDF m = 3.0 g = 2.0 mu = m sigma = g/sqrt(6.0) xmin = m - 1.1*g xmax = m + 1.1*g ymax = 1.1 * triangular(m, m, g) #Mode of triangular PDF used ymin = -ymax/11.0; unset key set zeroaxis set xrange [xmin: xmax] set yrange [ymin: ymax] set xlabel "x ->" set ylabel "probability density ->" set xtics autofreq set ytics autofreq set format x "%.1f" set format y "%.2f" set sample 50*1.1*g+1 set title "triangular PDF with m = 3.0, g = 2.0" plot triangular(x, m, g)Click here for minimal script to generate this plot

set title "triangular CDF with m = 3.0, g = 2.0" set yrange [-0.1: 1.1] plot ctriangular(x, m, g)Click here for minimal script to generate this plot

# Uniform PDF and CDF a = -2.0; b= 2.0 mu = (a + b) / 2.0 sigma = (b - a) / sqrt(12.0) xmin = a - 0.1*(b - a) xmax = b + 0.1*(b - a) ymax = 1.1 * uniform(mu, a, b) #No mode ymin = -0.1 * uniform(mu, a, b) unset key set zeroaxis set xrange [xmin: xmax] set yrange [ymin: ymax] set xlabel "x ->" set ylabel "probability density ->" set xtics autofreq set ytics autofreq set format x "%.2f" set format y "%.2f" set sample 120+1 set title "uniform PDF with a = -2.0, b = 2.0" plot uniform(x, a, b) with stepsClick here for minimal script to generate this plot

set title "uniform CDF with a = -2.0, b = 2.0" set yrange [-0.1 : 1.1] plot cuniform(x, a, b)Click here for minimal script to generate this plot

# Weibull PDF and CDF
lambda = 1.0/5; a = 1.0
mu = 1.0 / lambda * gamma(1.0 / a) / a
sigma = sqrt(lambda**(-2.0) * (2.0 * gamma(2.0 / a) / a - (gamma(1.0 / a) / a)**2))
xmin = mu - 4.0 * sigma
xmin = xmin < 0 ? 0 : xmin
#Mode of weibull PDF used
ymax = 1.8 * (a >= 1.0 ? weibull(((a - 1.0) / a)**(1.0 / a) / lambda, a, lambda) : 2.0)
lambda = 1.0/15; a = 10.0
mu = 1.0 / lambda * gamma(1.0 / a) / a
sigma = sqrt(lambda**(-2.0) * (2.0 * gamma(2.0 / a) / a - (gamma(1.0 / a) / a)**2))
xmax = int(mu + 4.0 * sigma)
set key on title "" inside top right
set zeroaxis
set grid
set xrange [xmin : xmax]
set xlabel "x ->"
set ylabel "probability density ->"
set xtics autofreq
set ytics autofreq
set format x "%g"
set format y "%g"
set sample 100
set title "weibull PDF"
ks(a,lambda) = sprintf("lambda = 1/%g, a = %0.1f", 1.0/lambda, a)
a1 = 0.5; a2 = 1.0; a3 = 2.0; a4 = 10.0
lambda1 = 1.0/5; lambda2 = 1.0/15
set arrow 1 from 3.8,0.27 to 0.5,weibull(0.5,a1,lambda1)
set label 1 "a < 1, rate descreasing over time" at 4,0.27 left
set arrow 2 from 8,0.19 to 6.4,weibull(6.4,a3,lambda1)
set arrow 3 from 10.5,0.19 to 13,weibull(13,a4,lambda2)
set label 2 "a > 1, rate increasing over time" at 9,0.2 center
plot [] [0:ymax] lambda = lambda1, a = a1, weibull(x, a, lambda) ti ks(a, lambda), \
                 lambda = lambda1, a = a2, weibull(x, a, lambda) ti ks(a, lambda), \
                 lambda = lambda1, a = a3, weibull(x, a, lambda) ti ks(a, lambda), \
                 lambda = lambda2, a = a4, weibull(x, a, lambda) ti ks(a, lambda)

Click here for minimal script to generate this plot

unset label 1; unset label 2
unset arrow 1; unset arrow 2; unset arrow 3
set key at 9,0.4 center
set title "weibull CDF"
plot [] [0:1.1] lambda = lambda1, a = a1, cweibull(x, a, lambda) ti ks(a, lambda), \
                lambda = lambda1, a = a2, cweibull(x, a, lambda) ti ks(a, lambda), \
                lambda = lambda1, a = a3, cweibull(x, a, lambda) ti ks(a, lambda), \
                lambda = lambda2, a = a4, cweibull(x, a, lambda) ti ks(a, lambda)

Click here for minimal script to generate this plot

reset