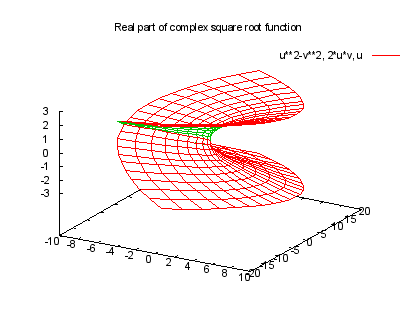
# $Id: singulr.dem,v 1.6 2003/10/28 05:35:54 sfeam Exp $ # # Demo that plots some surfaces with singularities. # Author: Carsten Steger # # (x,y,x^2-y^2,2xy) is the graph of w=z^2 in 4-space. # Therefore (x^2-y^2,2xy,x,y) is the graph of w=sqrt(z) in 4-space. # Coordinates 1, 2, and 3 give the real part of either function, # whereas coordinates 1, 2, and 4 give the imaginary part. # The same holds for the cube function w=z^3. The graphs are given by # (x,y,x^3-3xy^2,3x^2y-y^3) and (x^3-3xy^2,3x^2y-y^3,x,y). # And so on... set parametric set hidden3d set isosamples 21 set autoscale set view 60,30 set urange [-3:3] set vrange [-3:3] set title "Real part of complex square root function" splot u**2-v**2,2*u*v,uClick here for minimal script to generate this plot

set view 60,210 set title "Real part of complex square root function (different view)" replotClick here for minimal script to generate this plot
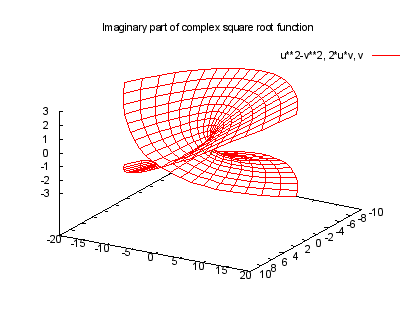
set view 60,120 set urange [-3:3] set vrange [-3:3] set title "Imaginary part of complex square root function" splot u**2-v**2,2*u*v,vClick here for minimal script to generate this plot
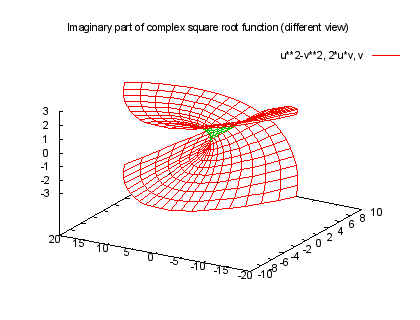
set view 60,300 set title "Imaginary part of complex square root function (different view)" replotClick here for minimal script to generate this plot

set view 60,30 set urange [-3:3] set vrange [-3:3] set title "Real part of complex cube root function" splot u**3-3*u*v**2,3*u**2*v-v**3,uClick here for minimal script to generate this plot

set view 60,210 set title "Real part of complex cube root function (different view)" replotClick here for minimal script to generate this plot
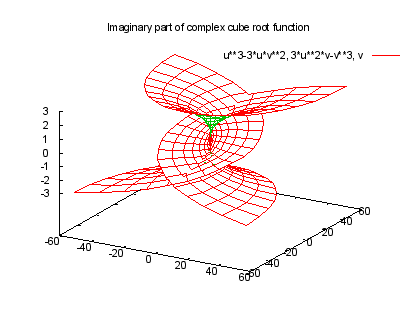
set view 60,30 set urange [-3:3] set vrange [-3:3] set title "Imaginary part of complex cube root function" splot u**3-3*u*v**2,3*u**2*v-v**3,vClick here for minimal script to generate this plot
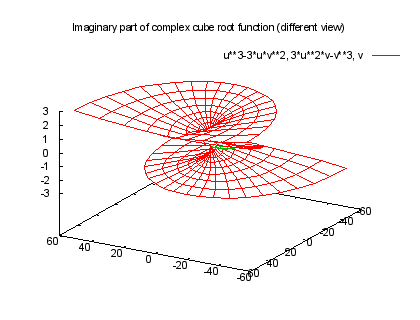
set view 60,210 set title "Imaginary part of complex cube root function (different view)" replotClick here for minimal script to generate this plot

set view 60,30 set isosamples 31 set urange [-1:1] set vrange [-1:1] set title "Real part of complex 4th root function" splot u**4-6*u**2*v**2+v**4,4*u**3*v-4*u*v**3,uClick here for minimal script to generate this plot
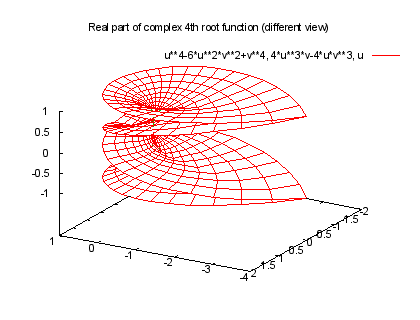
set view 60,210 set title "Real part of complex 4th root function (different view)" replotClick here for minimal script to generate this plot

set view 60,120 set urange [-1:1] set vrange [-1:1] set title "Imaginary part of complex 4th root function" splot u**4-6*u**2*v**2+v**4,4*u**3*v-4*u*v**3,vClick here for minimal script to generate this plot
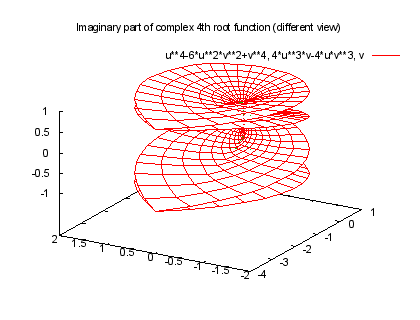
set view 60,300 set title "Imaginary part of complex 4th root function (different view)" replotClick here for minimal script to generate this plot
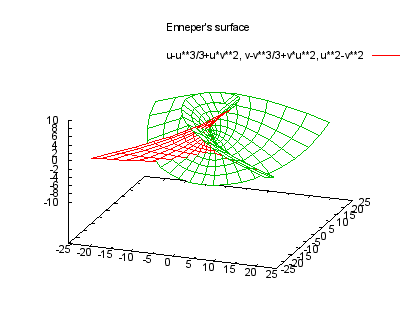
set isosamples 21 set view 60,20 set urange [-3:3] set vrange [-3:3] set title "Enneper's surface" splot u-u**3/3+u*v**2,v-v**3/3+v*u**2,u**2-v**2Click here for minimal script to generate this plot
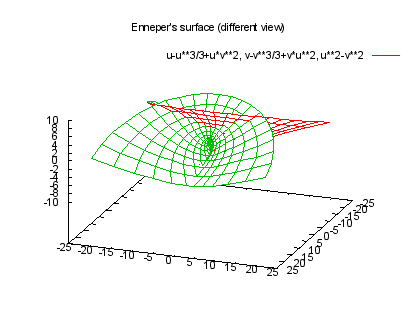
set view 60,110 set title "Enneper's surface (different view)" replotClick here for minimal script to generate this plot

set isosamples 31,11 set view 60,30 set title "Moebius strip" set urange [0:2*pi] set vrange [-0.25:0.25] splot (2-v*sin(u/2))*sin(u),(2-v*sin(u/2))*cos(u),v*cos(u/2)Click here for minimal script to generate this plot
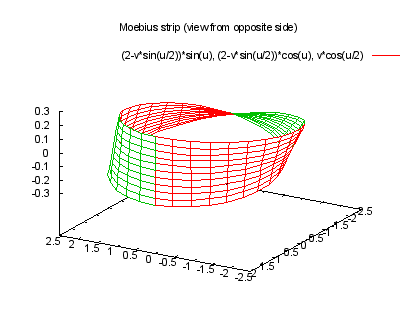
set view 60,210 set title "Moebius strip (view from opposite side)" replotClick here for minimal script to generate this plot

unset key
set xrange [-10:10]
set yrange [-10:10]
set zrange [-3:3]
set urange [0:2*pi]
set vrange [0:2*pi]
set isosamples 39,60
set view 60,120
set title "Klein bottle"
splot  (2*sin(u)*cos(v/2)-sin(2*u)*sin(v/2)+8)*cos(v), \
       (2*sin(u)*cos(v/2)-sin(2*u)*sin(v/2)+8)*sin(v), \
        2*sin(u)*sin(v/2)+sin(2*u)*cos(v/2)

Click here for minimal script to generate this plot

set urange [0:2*pi] set vrange [0:4*pi/3] set isosamples 39,40 set view 60,20 set title "Klein bottle with look at the 'inside'" replotClick here for minimal script to generate this plot
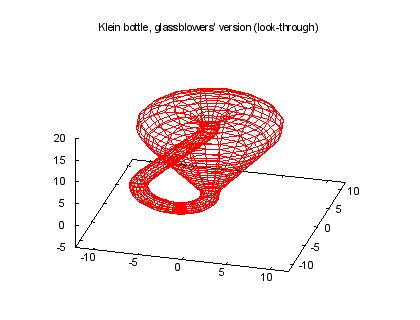
set style data lines set xrange [-12:12] set yrange [-12:12] set zrange [*:*] unset hidden3d set ticslevel 0. set view 50,15 #HBB: ,1,1.7 set title "Klein bottle, glassblowers' version (look-through)" splot "klein.dat"Click here for minimal script to generate this plot
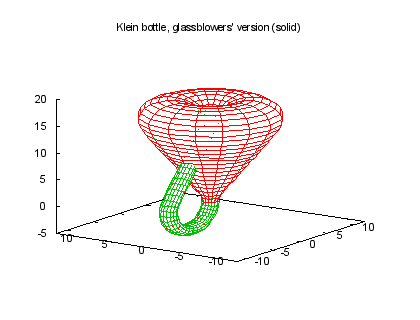
set hidden3d set view 70,305 set title "Klein bottle, glassblowers' version (solid)" splot "klein.dat"Click here for minimal script to generate this plot

reset