#
# demo for the use of "set object circle" and "plot ... with circles"
#
# Ethan A Merritt, Ralf Juengling - 2007,2008
if ((GPVAL_VERSION == 4.3 || GPVAL_VERSION == 4.2) \
&& (!strstrt(GPVAL_COMPILE_OPTIONS,"+OBJECTS"))) \
print ">>> Skipping demo <<<\n" ; \
print "This copy of gnuplot was built without support for circles\n" ; \
exit ;
set style fill solid 1.0 border -1
set obj 10 circle arc [ 0 : 20] fc rgb "red"
set obj 11 circle arc [ 20 : 50] fc rgb "orange"
set obj 12 circle arc [ 50 : 90] fc rgb "yellow"
set obj 13 circle arc [ 90 : 120] fc rgb "forest-green"
set obj 14 circle arc [120 : 190] fc rgb "dark-turquoise"
set obj 15 circle arc [190 : 360] fc rgb "dark-magenta"
set obj 10 circle at screen .18,.32 size screen .10 front
set obj 11 circle at screen .18,.32 size screen .10 front
set obj 12 circle at screen .18,.32 size screen .10 front
set obj 13 circle at screen .1767,.342 size screen .10 front
set obj 14 circle at screen .18,.32 size screen .10 front
set obj 15 circle at screen .18,.32 size screen .10 front
set obj 20 rect from graph 0,0 to graph 1,1 behind fc rgb "cyan" fs solid 0.2
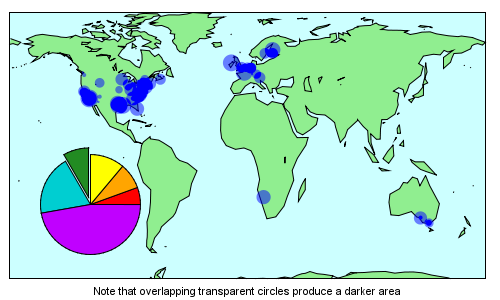
# plot world map and correspondent locations as a circle
set title ""
set xlabel "Note that overlapping transparent circles produce a darker area"
unset key
unset xtics
unset ytics
set border
set yrange [-70:*]
plot 'world.dat' with filledcurves lc rgb "light-green" , \
'world.cor' using 1:2:(7.*rand(0)) with circles lt 3 \
fs transparent solid 0.5 noborder
Click here for minimal script to generate this plot