#
# Demonstrate features of datastrings patch
# Ethan A Merritt <merritt@u.washington.edu>
# 08-Mar-2003
#
#
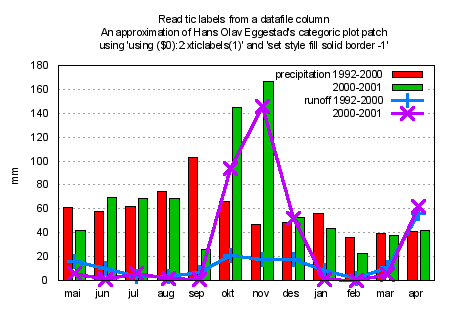
# Illustrate reading plot labels from column head in datafile
#
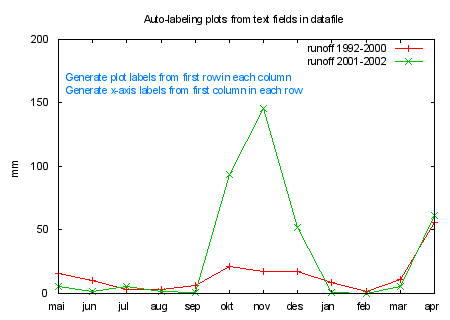
set title "Auto-labeling plots from text fields in datafile"
set label 1 "Generate plot labels from first row in each column"
set label 1 at graph 0.02, 0.85 tc lt 3
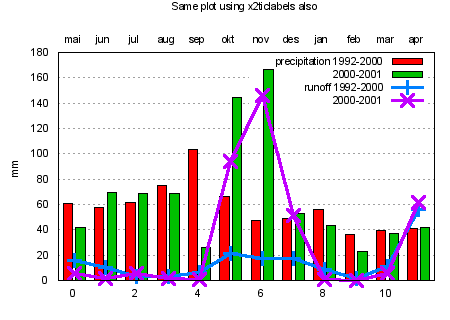
set label 2 "Generate x-axis labels from first column in each row"
set label 2 at graph 0.02, 0.80 tc lt 3
set style data linespoints
set ylabel "mm"
set yrange [0:200]
#
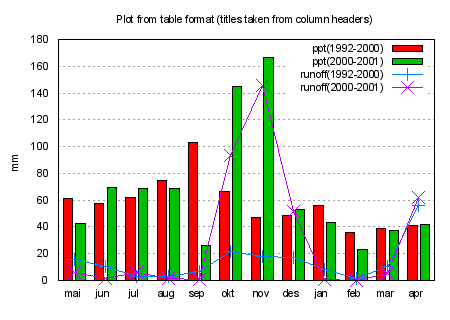
set key autotitle columnhead
plot 'ctg-y2.dat' using 2:xticlabel(1) index 2, \
'' using 2 index 3
#
Click here for minimal script to generate this plot