set border -1 front linetype -1 linewidth 1.000
set ticslevel 0
set xtics border
set ytics border
set ztics border
set xlabel "Red" tc rgb "red"
set xrange [0:255]
set ylabel "Green" tc rgb "green"
set yrange [0:255]
set zlabel "Blue" tc rgb "blue"
set zrange [0:255]
#
rgb(r,g,b) = int(r)*65536 + int(g)*256 + int(b)
#
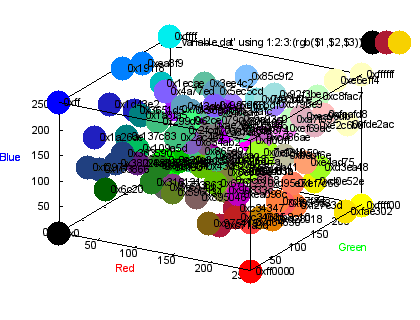
splot 'rgb_variable.dat' using 1:2:3:(rgb($1,$2,$3)) with points pt 7 ps 4 lc rgb variable, \
'' using 1:2:3:(sprintf("0x%x",rgb($1,$2,$3))) with labels left offset 1 notitle
Click here for minimal script to generate this plot
#
#
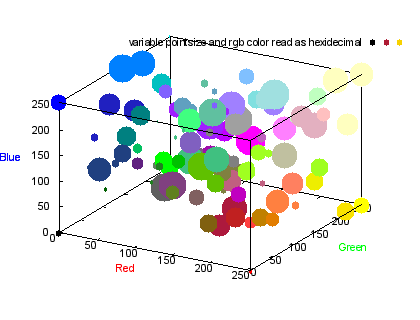
# Unfortunately, not all platforms allow us to read hexadecimal constants
# from a data file. Warn the user if that is the case.
#
if (0 == int('0x01')) \
set label 99 at screen .05, screen .15 "If you see only black dots,\nthis means your platform does not \nsupport reading hexadecimal constants\nfrom a data file. Get a newer libc."
splot 'rgb_variable.dat' using 1:2:3:(5*rand(0)):4 with points pt 7 ps variable lc rgb variable \
title "variable pointsize and rgb color read as hexidecimal"
Click here for minimal script to generate this plot
set label 99 ""
#
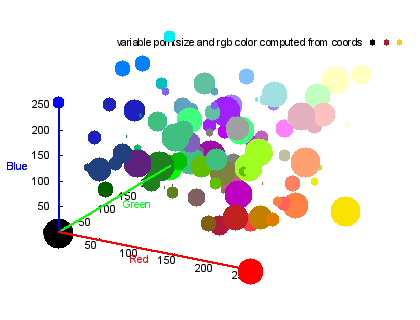
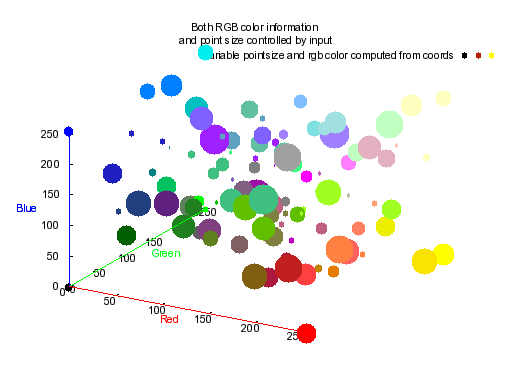
set border 0
set xtics axis nomirror
set ytics axis nomirror
set ztics axis nomirror
set xzeroaxis lt -1 lc rgb "red" lw 2
set yzeroaxis lt -1 lc rgb "green" lw 2
set zzeroaxis lt -1 lc rgb "blue" lw 2
set xyplane at 0.0
splot 'rgb_variable.dat' using 1:2:3:(5*rand(0)):(rgb($1,$2,$3)) with points pt 7 ps variable lc rgb variable \
title "variable pointsize and rgb color computed from coords"
Click here for minimal script to generate this plot
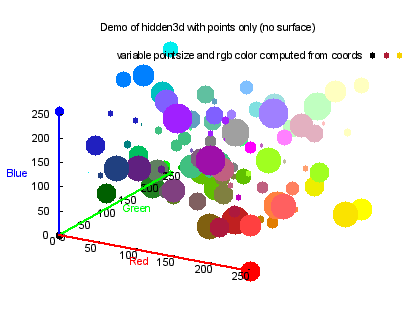
set title "Demo of hidden3d with points only (no surface)" set hidden3d replotClick here for minimal script to generate this plot
#
reset