Back to demo index

gnuplot demo script: polar.dem

autogenerated by webify.pl on Tue Apr 14 15:20:27 2009
gnuplot version gnuplot 4.3 patchlevel CVS-12Apr2009
#
# $Id: polar.dem,v 1.6 2004/01/13 07:01:10 sfeam Exp $
#
# Show some of the new polar capabilities.
#
unset border
set clip
set polar
set xtics axis nomirror
set ytics axis nomirror
set samples 160
set zeroaxis
set trange [0:2*pi]
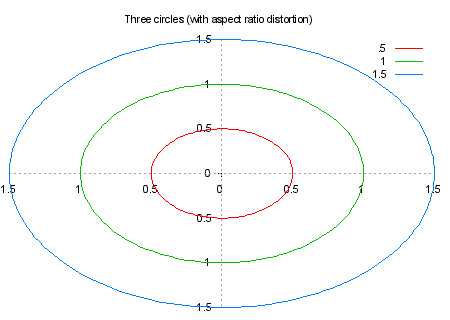
set title "Three circles (with aspect ratio distortion)"
plot .5,1,1.5

Click here for minimal script to generate this plot


set title ""
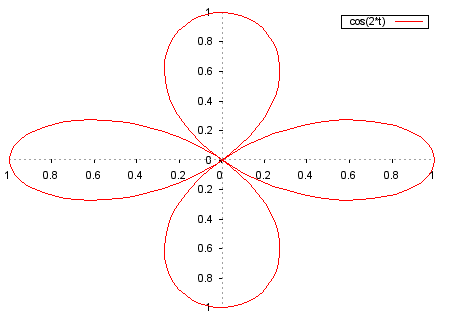
set key box

plot cos(2*t)

Click here for minimal script to generate this plot
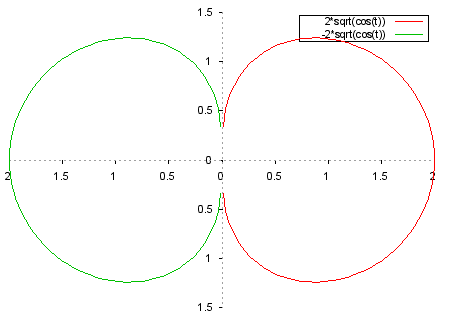


plot 2*sqrt(cos(t)),-2*sqrt(cos(t))

Click here for minimal script to generate this plot
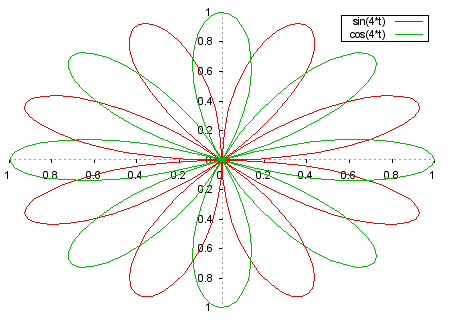


plot sin(4*t),cos(4*t)
set offset 0,0,0,0

Click here for minimal script to generate this plot
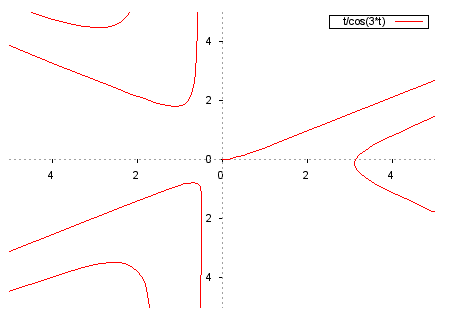


set xrange [-5:5]
set yrange [-5:5]
plot t/cos(3*t)

Click here for minimal script to generate this plot
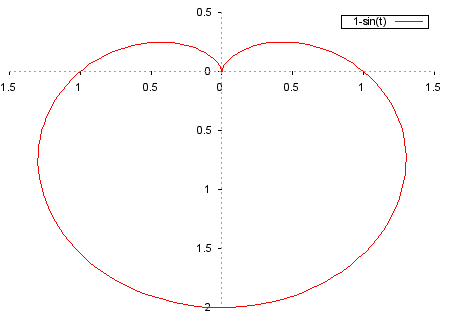


set autoscale

plot 1-sin(t)

Click here for minimal script to generate this plot
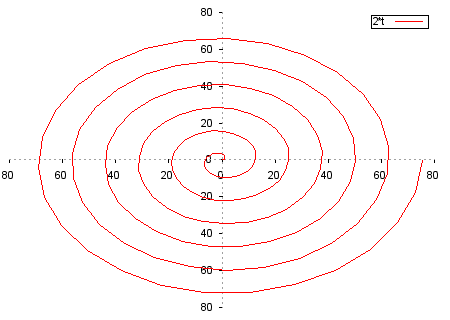


set trange [0:12*pi]
plot 2*t

Click here for minimal script to generate this plot
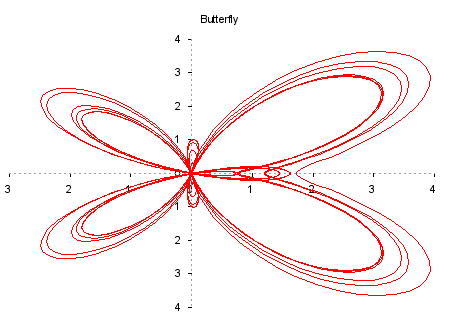


butterfly(x)=exp(cos(x))-2*cos(4*x)+sin(x/12)**5
set samples 800
print "This is a big one (many samples), be patient..."
set title "Butterfly"
unset key
plot butterfly(t)

Click here for minimal script to generate this plot


# undo what we've done above