#
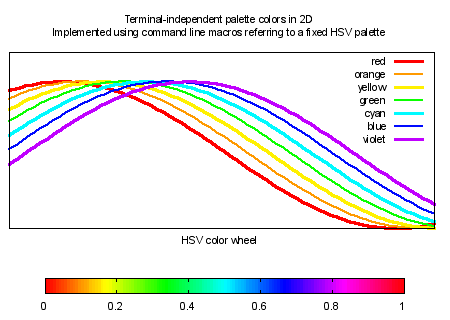
# Demonstrate use of pm3d palette colors for 2D plots
# terminal-independent color choices
#
#
set title "Terminal-independent RGB colors in 2D"
set xlabel "Implemented using built-in rgb color names\n(only works for terminals that can do full rgb color)"
#
set xrange [-0.5:3.5]
set yrange [-1:1.4]
set bmargin 7
unset ytics
unset xtics
#
# define line styles using explicit rgbcolor names
#
set style line 1 lt rgb "red" lw 3
set style line 2 lt rgb "orange" lw 2
set style line 3 lt rgb "yellow" lw 3
set style line 4 lt rgb "green" lw 2
set style line 5 lt rgb "cyan" lw 3
set style line 6 lt rgb "blue" lw 2
set style line 7 lt rgb "violet" lw 3
#
set label 1 'set style line 1 lt rgb "red" lw 3'    at -0.4, -0.25 tc rgb "red"
set label 2 'set style line 2 lt rgb "orange" lw 2' at -0.4, -0.35 tc rgb "orange"
set label 3 'set style line 3 lt rgb "yellow" lw 3' at -0.4, -0.45 tc rgb "yellow"
set label 4 'set style line 4 lt rgb "green" lw 2'  at -0.4, -0.55 tc rgb "green"
set label 5 'set style line 5 lt rgb "cyan" lw 3'   at -0.4, -0.65 tc rgb "cyan"
set label 6 'set style line 6 lt rgb "blue" lw 2'   at -0.4, -0.75 tc rgb "blue"
set label 7 'set style line 7 lt rgb "violet" lw 3' at -0.4, -0.85 tc rgb "violet"
#
print ''
print '# These are the input commands'
print ''
print '	set style line 1 lt rgb "red" lw 3'
print '	set style line 2 lt rgb "orange" lw 2'
print '	set style line 3 lt rgb "yellow" lw 3'
print '	set style line 4 lt rgb "green" lw 2'
print '	set style line 5 lt rgb "cyan" lw 3'
print '	set style line 6 lt rgb "blue" lw 2'
print '	set style line 7 lt rgb "violet" lw 3'
print ''
print '# And this is the result'
#
show style line
#
# draw some plots
#
plot cos(x)     ls 1 title 'red',   \
     cos(x-.2)  ls 2 title 'orange',\
     cos(x-.4)  ls 3 title 'yellow',\
     cos(x-.6)  ls 4 title 'green', \
     cos(x-.8)  ls 5 title 'cyan',  \
     cos(x-1.)  ls 6 title 'blue',  \
     cos(x-1.2) ls 7 title 'violet'
#

Click here for minimal script to generate this plot

