Back to demo index

gnuplot demo script: surface2.dem

autogenerated by webify.pl on Tue Apr 14 15:20:37 2009
gnuplot version gnuplot 4.3 patchlevel CVS-12Apr2009
#
# $Id: surface2.dem,v 1.4 1999/10/17 19:17:01 lhecking Exp $
#
set parametric
set isosamples 50,10
set hidden
set key below

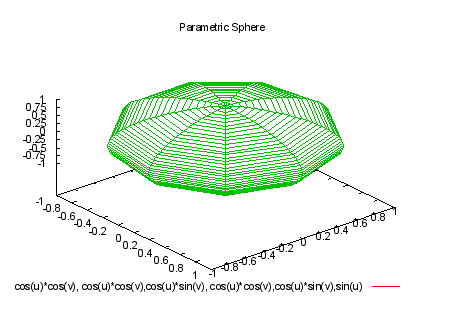
set title "Parametric Sphere"
set urange [-pi/2:pi/2]
set vrange [0:2*pi]
set ztics nomirror -1.0,0.25,1.0
set view 45,50
splot cos(u)*cos(v),cos(u)*sin(v),sin(u)

Click here for minimal script to generate this plot
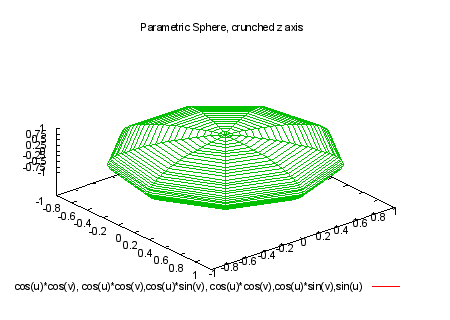


set view ,,,0.7
set title "Parametric Sphere, crunched z axis"
replot

Click here for minimal script to generate this plot
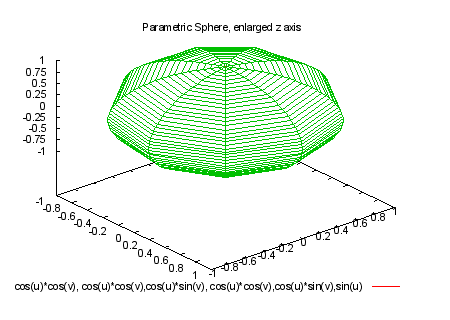


set view ,,,1.4
set title "Parametric Sphere, enlarged z axis"
replot

Click here for minimal script to generate this plot


set view ,,,1.0

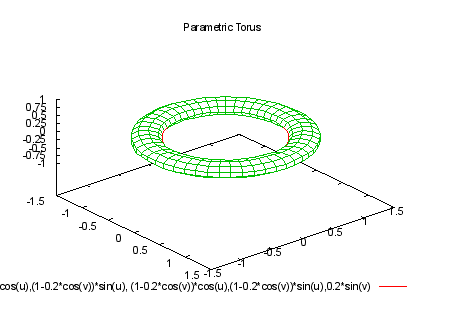
set title "Parametric Torus"
set urange [0:2*pi]
set vrange [0:2*pi]
set zrange [-1:1]        # imitate old 'set view' hack
splot (1-0.2*cos(v))*cos(u),(1-0.2*cos(v))*sin(u),0.2*sin(v)

Click here for minimal script to generate this plot
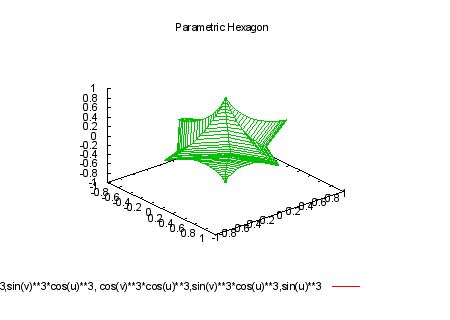


set title "Parametric Hexagon"
set urange [-1.3:1.3]
set vrange [0:2*pi]
set autoscale z
set ticslevel 0.	# reserve more space z direction.
set view ,,0.7,1.4	# crunch xyz, and re-extend z back to full size
set ztics autofreq
splot cos(v)**3*cos(u)**3,sin(v)**3*cos(u)**3,sin(u)**3

Click here for minimal script to generate this plot
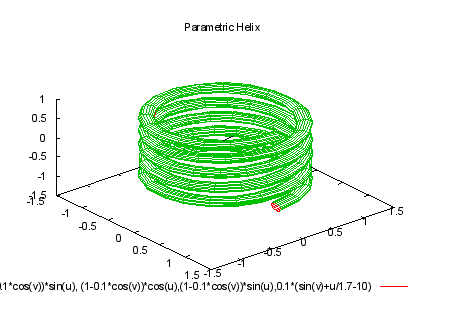


set view ,,1.,1.

set title "Parametric Helix"
set isosamples 100,20
set urange [0:10*pi]
set vrange [0:2*pi]
set autoscale z
splot (1-0.1*cos(v))*cos(u),(1-0.1*cos(v))*sin(u),0.1*(sin(v)+u/1.7-10)

Click here for minimal script to generate this plot
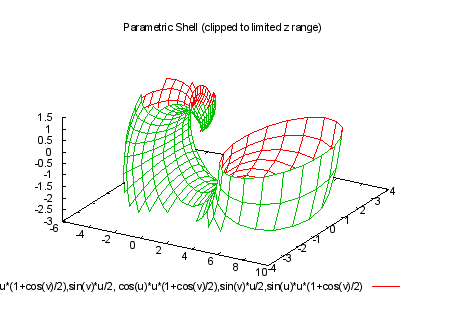


set title "Parametric Shell (clipped to limited z range)"
set isosamples 40,20
set view 50,30,1.0
set urange [0:2*pi]
set vrange [0:2*pi]
set zrange [-3:1.5]
splot cos(u)*u*(1+cos(v)/2),sin(v)*u/2,sin(u)*u*(1+cos(v)/2)

Click here for minimal script to generate this plot
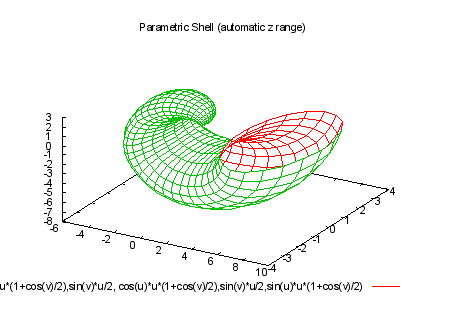


set autoscale z
set title "Parametric Shell (automatic z range)"
replot

Click here for minimal script to generate this plot


set title "Interlocking Tori"

set urange [-pi:pi]
set vrange [-pi:pi]
set isosamples 50,20
splot cos(u)+.5*cos(u)*cos(v),sin(u)+.5*sin(u)*cos(v),.5*sin(v) with lines, \
      1+cos(u)+.5*cos(u)*cos(v),.5*sin(v),sin(u)+.5*sin(u)*cos(v) with lines

Click here for minimal script to generate this plot