#
# $Id: timedat.dem,v 1.7 2003/10/28 05:35:54 sfeam Exp $
#

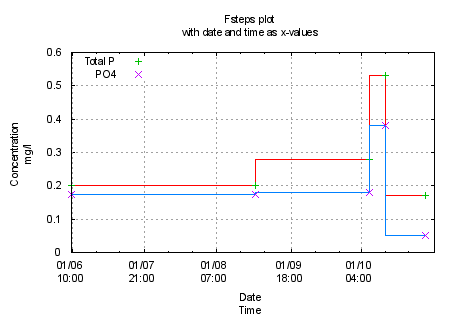
set title "Fsteps plot\nwith date and time as x-values"
set style data fsteps
set xlabel "Date\nTime"
set timefmt "%d/%m/%y\t%H%M"
set yrange [ 0 : ]
set xdata time
set xrange [ "1/6/93":"1/11/93" ]
set ylabel "Concentration\nmg/l"
set format x "%d/%m\n%H:%M"
set grid
set key left
plot 'timedat.dat' using 1:3 t '', \
     'timedat.dat' using 1:3 t 'Total P' with points, \
     'timedat.dat' using 1:4 t '', \
     'timedat.dat' using 1:4 t 'PO4' with points

Click here for minimal script to generate this plot
