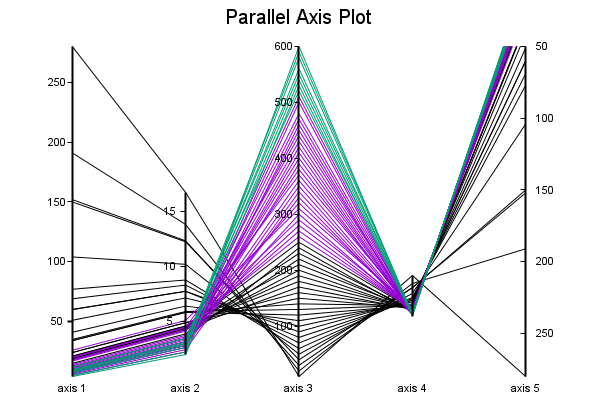
# # Parallel axis plot # shows plot layout but would better use some real data set # set title "Parallel Axis Plot" font ",15" set border 0 unset key set xrange [] noextend unset ytics # Use x-axis tic positions to label the axes set xtics 1 format "axis %g" scale 0,0 # Turn on axis tics for the parallel axes set for [i=1:5] ptics i # Use the range commands to create an "interesting" plot. # For suitable input data this is the sort of result you # might get without axis range manipulation. set prange 2 [0:30] set prange 4 [-10:50] set prange 5 [50:*] reverse set ptics 5 left offset 4 plot 'silver.dat' using 2:3:1:($3/2):2:(int($0/25)) with parallel lt 1 lc variableClick here for minimal script to generate this plot

