Back to demo index

gnuplot demo script: polargrid.dem

autogenerated by webify.pl on Wed Aug 21 21:28:38 2024
gnuplot version gnuplot 6.1 last modified 2024-08-21
#
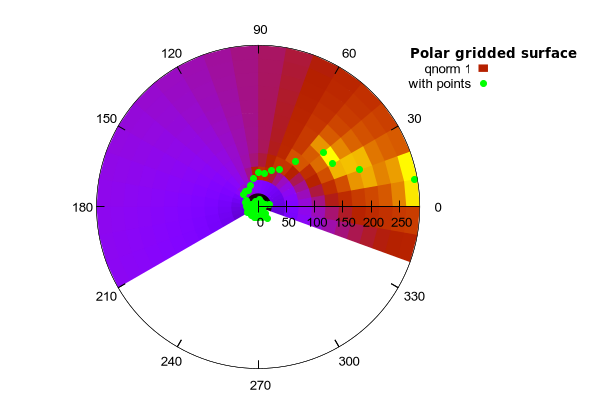
# Exercise polar gridded surfaces
#	configure --enable-polar-grid
#
# Current bugs:
# - R_AXIS.min nonzero produces an odd plot
#	although to be fair it matches existing polar plots
# - polar border should not be clipped by border if the border
#	is not drawn (but this would break polar_quadrants.dem
#

if (!strstrt(GPVAL_COMPILE_OPTIONS, "+POLARGRID")) {
    print "This copy of gnuplot does not support polar gridding"
    exit  # return to caller
}

set key rmargin vertical top title "Polar gridded surface" font ":Bold"
set key samplen 0.5
set lmargin 5
set rmargin screen 0.7

set ang degree
set polar
set polar grid 36,12 theta [-20:210]

set rrange [*:*] noextend
set isotropic

set tics front
unset xtics
unset ytics
set rtics 50
set ttics 0,30,330
set border 0 polar
unset colorbox

plot 'silver.dat' using 1:2:3 with surface title "qnorm 1", \
     '' using 1:2:3 with points pt 7 lc "green" title "with points"

show polar
show rrange


Click here for minimal script to generate this plot


set style fill solid
set multiplot
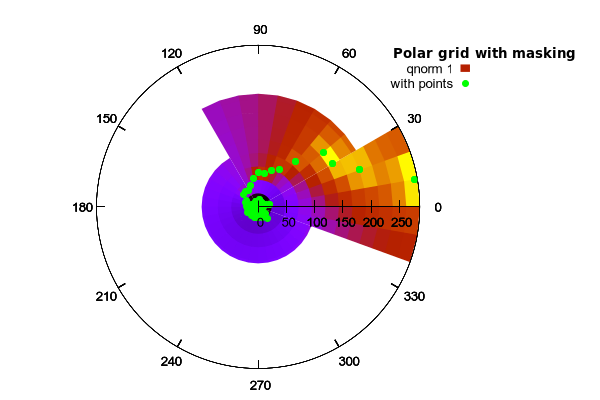
    set key title "Polar grid with masking"
    set polar grid theta [-20:30] r [*:*]
    replot
    unset key
    set polar grid theta [30:120] r [0:200]
    replot
    set polar grid theta [120:-20] r [0:100]
    replot
unset multiplot
unset polar grid
unset style fill


Click here for minimal script to generate this plot


set key rmargin vertical top title "Polar gridded surface" font ":Bold"
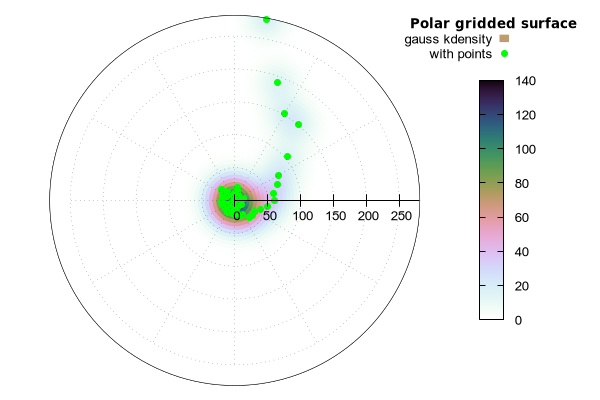
set polar grid 360, 50 theta [0:360] gauss kdensity scale 30
set grid front
set palette cubehelix negative
set theta top clockwise
set colorbox user origin 0.8, 0.2 size 0.04, 0.6

plot 'silver.dat' using 1:2:3 with surface title "gauss kdensity", \
     '' using 1:2:3 with points pt 7 lc "green" title "with points"

show polar
show theta


Click here for minimal script to generate this plot
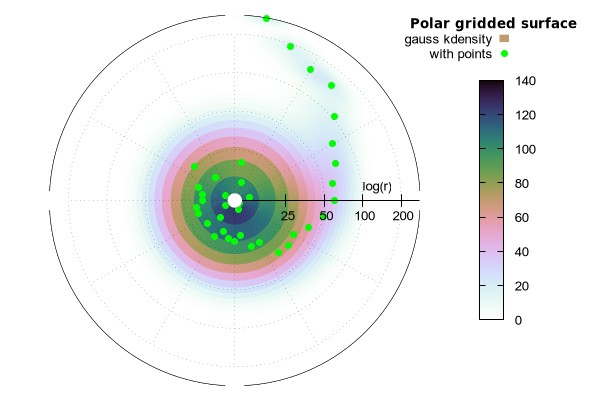


set log r
set rrange [10:*]
set rlabel "log(r)" left offset 5

set rtics (25,50,100,200)
replot


Click here for minimal script to generate this plot